
Choosing the right stocks for swing trading is one of the most overlooked yet essential factors for achieving consistent results, whether you are a beginner or an experienced trader.
Having the right stock screener and filtering out the bad stocks can make the difference between being profitable or not in this game.
In this article, I’ll share my experience and walk you through how to scan for the best swing trading stocks using TC2000. This scan was developed through extensive trial and error, so let’s dive in.
In This Article:
TC2000 Swing Trading Stock Scanning
1. Find EasyScans
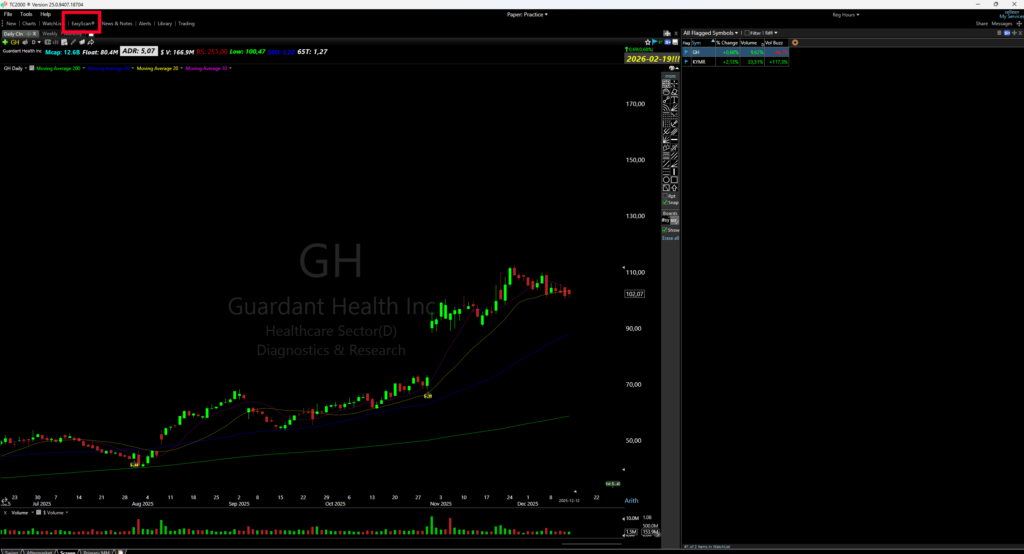
First, open TC2000 and find the EasyScans tab in the menu. Click this one to open another box.
2. Write Formula
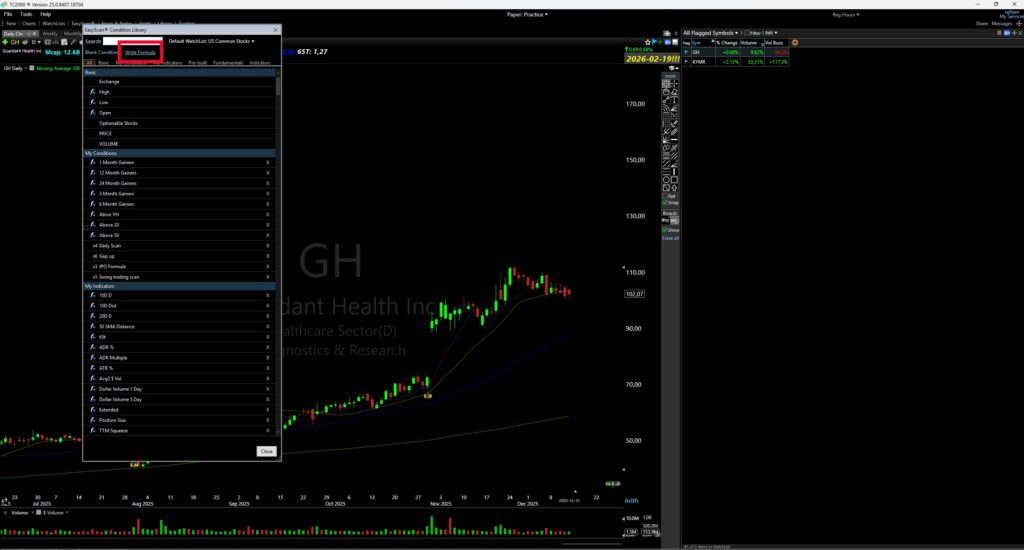
When you have this tab open, you will see all your saved scans and the built-in scanning functions. Instead, we are going to create a new scan, so click Write Formula.
3. Stock Criteria TC2000
Once you have clicked the button, it should open a new window with an empty scan. You can name the scan whatever you want in the Header box.
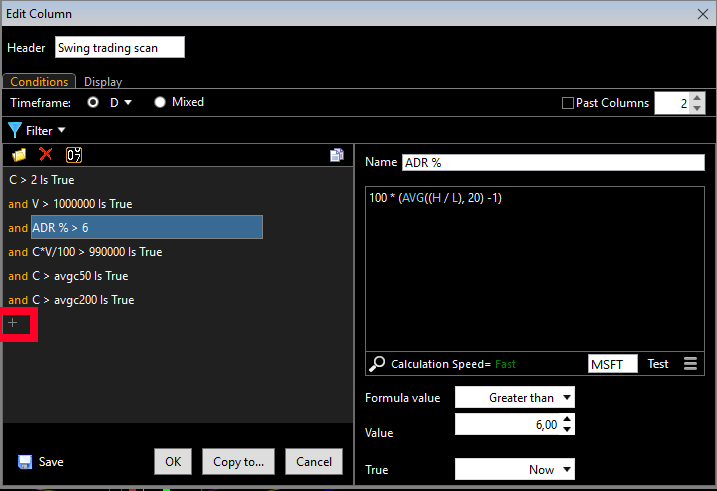
In the first box, enter the stock price; we will go through how to do this soon. To add additional conditions, click the “+” icon and press Write Formula.
These are the scan conditions I recommend using in TC2000, or any similar platform, especially if you’re a beginner.
- Price > $2
- Volume > 1 Million
- Average Daily Range > 6
- Dollar Volume > $100M
- Above 200 and 50 simple moving average
Let’s take a deeper look at the conditions used in this scan and the reasons behind each one, so you can understand how I find the best stocks with TC2000.
Price > $2
The first thing we want to filter with is the price. You can use the built-in price function in TC2000, but in this guide, we will write all the scans using PCF formulas. In this case, if you want the stock price to be $2, use this formula.
C > 2You can use whatever you want, but I prefer stocks at least $2 because I have found I’m more profitable with higher-priced stocks. If you are a beginner, you can use a stock price of $5 or even $10, but then you may need to lower the other conditions to get enough stocks in the scan.
Volume > 1M
The next thing we will enter is the share volume. I would recommend at least 500k shares traded in a day, but you can go up to 1 million shares. Stocks that trade a lot of shares usually have less spread and are easier to trade, in my opinion.
The formula for volume in Tc2000 is:
V > 1000000ADR > 6
Then we have the ADR or Average Daily Range. You can also use ATR (Average True Range), but I use ADR since it won’t calculate the range with gaps. You want stocks with high ADR because they have established momentum, and it’s critical for trading success, in my opinion.
If the stocks lack momentum, they will, in many cases, stop you out and chop around. Stocks with high ADR will quickly move away from your stop and make big moves quickly. Therefore, I would recommend scanning for stocks with at least 5 ADR, or even 6 ADR, as we do in this scan.
The formula for ADR % in tc2000 is:
100 * (AVG((H / L), 20) -1) > 6You can read more about this in my separate article: ADR and ATR PCF Formula for TC2000
Dollar Volume > 100M
We also want to filter by dollar volume, and not just share volume. The dollar volume is basically price * share volume, and it shows you how much $ value is traded in the stock on each day.
For example, if you only look at the share volume, it’s a massive difference if the stock trades 100k shares a day, whether it’s a $1 or a $500 stock. Therefore, I find dollar volume to be more useful.
You want the dollar volume to be at least 50M, even if you have a small account. This means institutions are interested, and stocks with high dollar volume trade much more nicely in my opinion.
I use a minimum of 100M dollar volume, and it’s also what we use in this scan. The dollar volume PCF for TC2000 is:
C*V/100 > 1000000You can also write it without the /100, but it makes it easier when there are so many 0’s. You can read more about this in my other article: Dollar Volume PCF Formula for TC2000
Price Above Simple Moving Averages
You also want to look for stocks trading above the 50- and 200-day simple moving averages. This will ensure you are only looking at the strongest stocks with a confirmed uptrend. The strongest stocks will both give you the best longs and the best shorts if you swing trade like me.
The TC2000 PCF for prices above the simple moving averages is as follows:
C > avgc50 and C > avgc200Fundamentals (Optional)
While TC2000 lacks strong fundamental scanning, I also like to trade stocks with 30% annual revenue growth. You can do this manually by using more reliable software for fundamentals like MarketSurge.
Stocks with high revenue growth often attract institutions and funds, which can result in the stock making big moves over a long period.
4. Final Results
Once you’ve entered all the PCFs, save the scan, then press Copy To… and select New filtered Watchlist. This will open a new window, and if you did everything right, you should get results similar to this with around 30-50 stocks, depending on your settings and the market conditions.
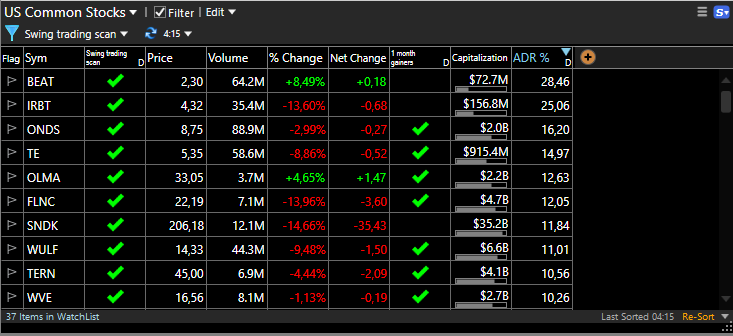
In this case, I only get 37 stocks in the scan, mainly because the market has been choppy when I wrote this guide. In other cases, you will find around 50 stocks using these screener settings.
I would still recommend changing the settings to get around 40-50 stocks in your scan, and if you get above 50, you should definitely sharpen the criteria a bit. You can adjust the volume, dollar volume, and ADR to get fewer or more results in the watchlist.
Last Words
By using these settings in TC2000, you will find the most liquid, high-momentum leaders in the market, which is a good recipe for success.
I see so many people trading low-liquidity and random stocks, which often stop you out and make irrational moves even when the chart looks good.
If you have any further questions or would like me to add anything, let me know in the comments below. If you want to learn the setups for trading these stocks, check out my other articles or follow me on X/twitter (@sellentrading), where I post actionable stock charts in real time.


