

With so much information out there about swing trading strategies and setups, it can easily become overwhelming, especially when you don’t even know if a strategy is actually profitable.
That’s why I want to share five of my best swing trading setups that I personally trade on a daily basis. These setups are timeless and have been working for many years. If you want to convince yourself, go through old charts, and I’m sure you will find these setups over and over.
First, I will show you the swing trading setups that I trade myself. After that, I’ll teach you some important things you need to know to become a profitable trader. So let’s dive straight into it.
In This Article:
The Best Swing Trading Setups
1. Flag Breakout
If you’ve been into trading for a while, you have probably heard about breakouts or flag breakouts. You have most likely also heard discussions about whether they actually work, since there is so much conflicting information about them.
The key to getting these flag breakouts to work is to trade the momentum leaders. These are the liquid stocks with strong momentum. The momentum will cause them to move away from your stop and make big moves quickly.
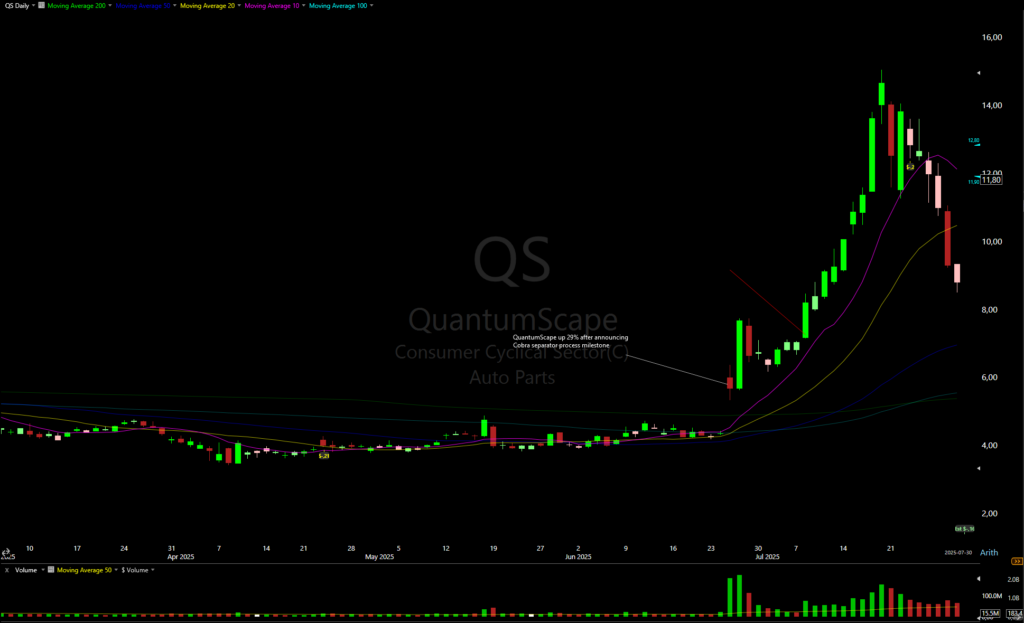
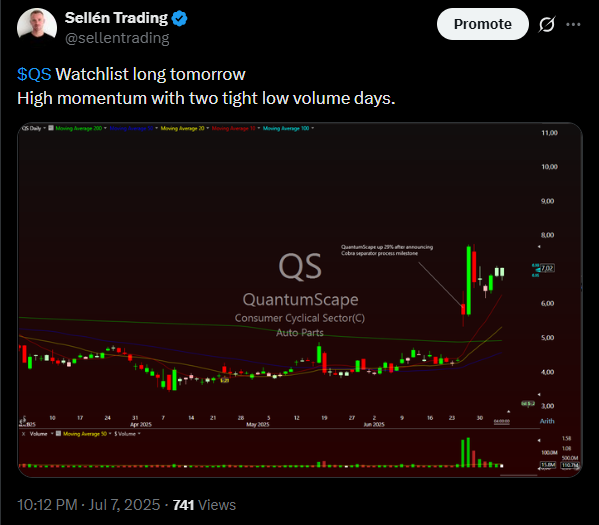
The chart above is $QS, which I traded previously this year. It had a perfect short flag, and I also posted this setup before the move on X/twitter:
There are many different types of flags and flag breakouts. Still, you usually can identify them by looking for stocks that made a big move, then go sideways and become tighter and tighter, preferably with one or two very tight and low-volume days before the breakout. This allows you to enter with a tight stop (usually at the day’s low).
I enter these flag breakouts with a 1 or 5-minute opening range high, and always ABOVE the previous day’s high.
You want the 10 or 20 SMA to catch up to the price before you take the setup, to prevent you from getting stopped out by false breakouts. Here are some things to look for to find these setups:
- Big move up 30-150%+ within a month
- Sideways for a few days
- Dropping volume
- 10 and 20 simple moving averages catch up
- A tight, low-volume day before the breakout
- Liquid stock (High volume and dollar volume)
Longer flag breakout
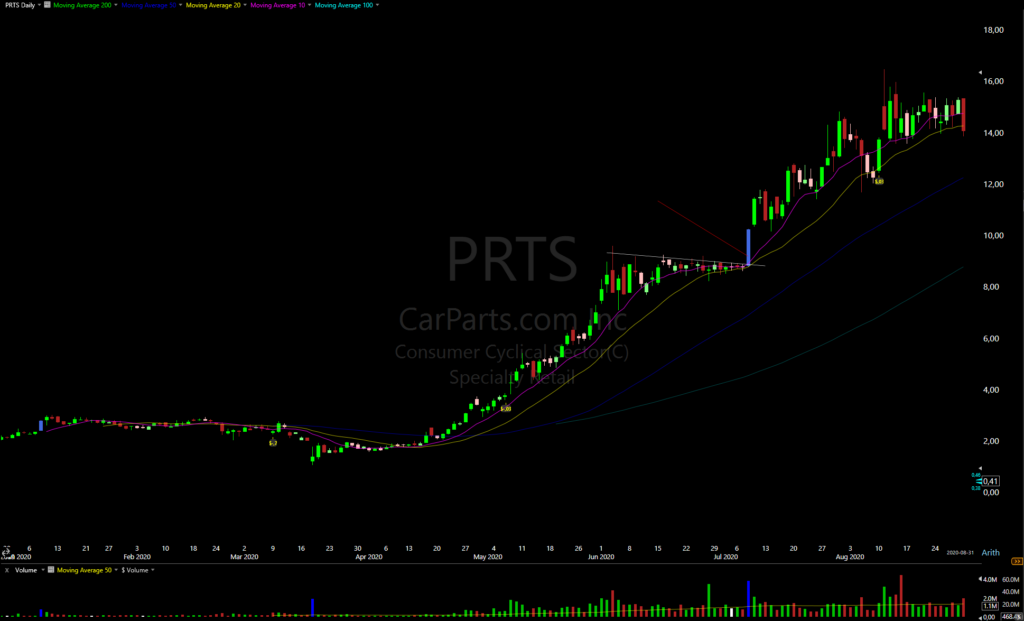
While the $QS setup was a high-momentum stock and went even before the 10 SMA caught up, many setups bounce from the 20 SMA instead. The example above, $PRTS in 2020, is one of the best 20-SMA bounce examples among these variants.
You preferably want to look for the first or second flag out of a base to ensure it’s not too extended before entry, which often results in false breakouts.
Sell rules for flag breakouts:
Most flag breakouts will make most of the move within 5 days; therefore, I would recommend selling half of the position after 3-5 days if it makes a big move. Then wait for a red CLOSE below the 10 SMA and sell the rest of the position.
If you enter on the first flag out of a base, you can even use a part of the position to trail it with the 20 SMA, but this requires some skill to do it on the right stocks.
2. Base Breakout
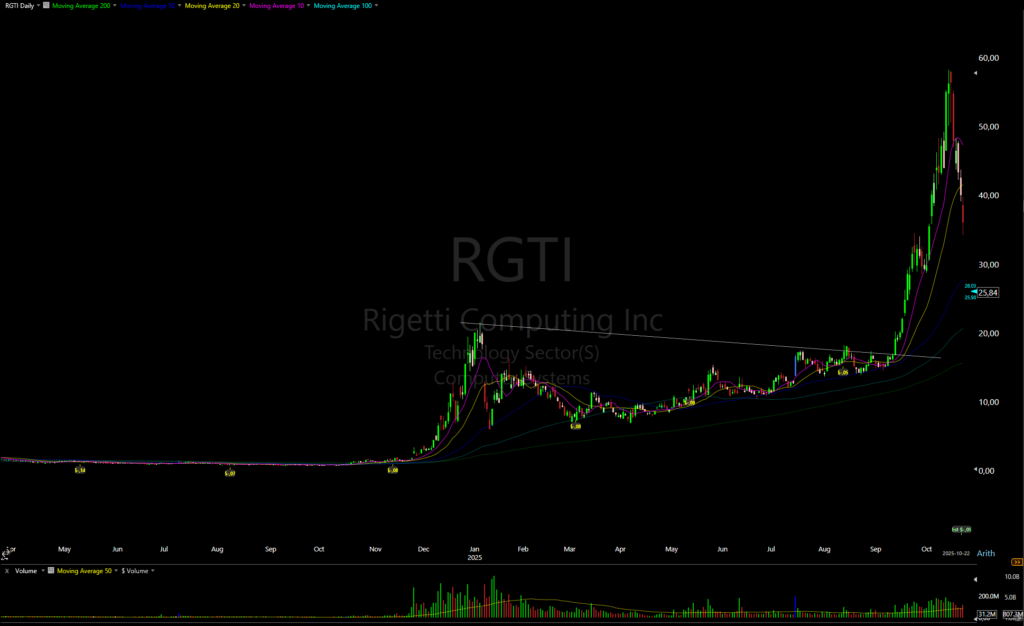
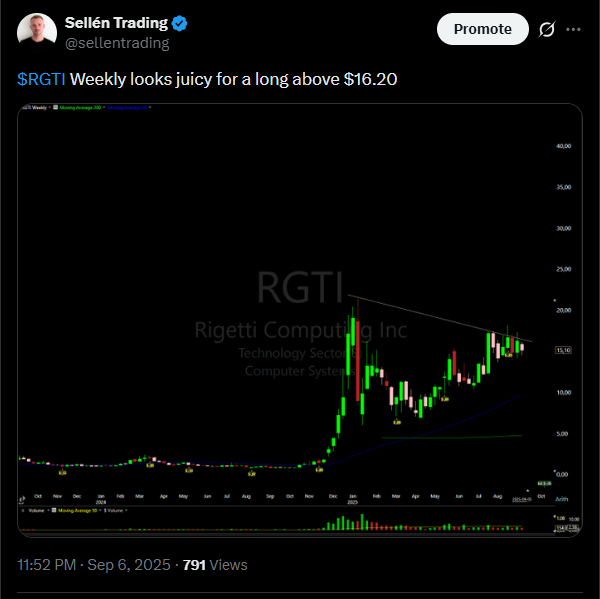
If you want to enter before a flag breakout, the stock will often come out of a big base first. This can result in huge moves, such as the $RGTI example above. This is also a stock that I posted before, and I identified it by looking at the weekly chart and seeing a tight, low-volume week before entry.
The pro of base breakouts is that they often result in huge moves, and you can often enter before the first flag is formed. The problem is that until the stock makes the real move, it can have 3-4 false breakouts, and that can cost you a lot of money.
The key is to trade the strongest stocks over a 12 to 24-month period, wait until they get really tight. But it’s definitely easier said than done, so I usually prefer to let the momentum establish itself first.
You can identify the breakout by drawing trendlines over previous highs. You also want to see the stock make higher lows and for the 10- and 20-day moving averages to untangle. You want the 10 SMA to be above the 20 SMA, 20 above 50, etc, but it’s not always the case. It’s still a good indicator to look for.
Some other recent big base breakouts you can study are $NVDA and $SMCI in 2024.
Sell rules for base breakouts:
Since these can make such big moves, you preferably don’t want to take profits too quickly. However, you can take 30% off after 3-5 days, then wait for a red CLOSE below the 10- or 20-SMA before selling the rest. If you are a beginner, use the 10 SMA.
3. EP
The next setup we will go through is the EP, which can mean either Episodic Pivot or Earnings Play, depending on whom you ask. I see them as two different setups.
An episodic pivot is usually a piece of news that will change the company’s trajectory for a long time. This should come as a surprise to the market, which will trigger multi-week moves when institutions and funds buy them.
Earnings Play is the quarterly financial report, and a much more common trade for me, since every company reports four times a year. Learning earning plays can take a couple of cycles, and you really need to study them to become good at them. Here are some of the key things I look for:
- Annual Revenue Growth of 30%+
- Coming out of a base
- Gapping above all moving averages
- Huge EPS and Revenue Surprise is a big +
- EPS growth is also good
While many people look at the EPS growth or EPS and revenue surprise, I’ve found that revenue growth and the chart pattern are much more important. You don’t want to take setups that can’t even gap up above the moving averages, especially if they are declining.
I usually enter EPs with 1 or 5 minute opening range high, and placing the stop at the day’s low. If I get stopped out, I wait for either it to take out the highs again or for it to reclaim and build a flag above VWAP on a smaller timeframe.
These stocks can move super quickly, and sometimes, if you wait for the 5-minute ORH/ORB, your stop will become way too wide. This is a skill you will learn with time and by studying.
Sell rules for EPs
I usually sell 30-50% after 3-5 days with EPs, then trail the rest and wait for a red CLOSE below the 10- and/or 20-simple moving averages. This, however, depends on the stock, and if you are a beginner, you should use the 10 SMA as your trailing stop.
4. Parabolic Short
If you’re tired of going long all the time, the best short setup I know is the parabolic short. This is essentially stocks that are going parabolic up for 3-5 days in a row. It usually speeds up, and over the last two days it has gapped up. On the 2nd or 3rd gap-up day, you short it.
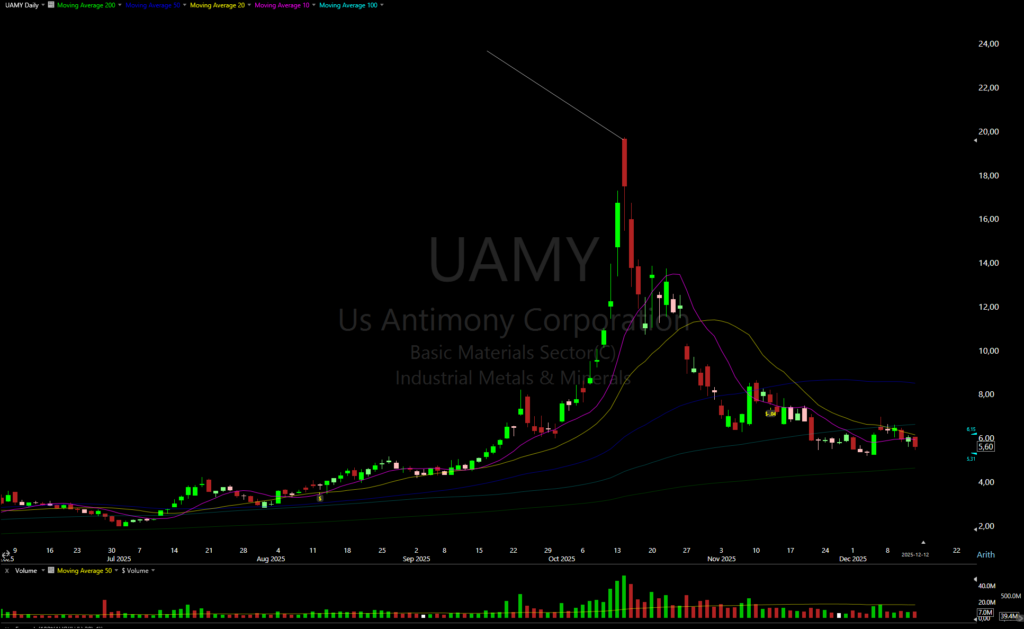
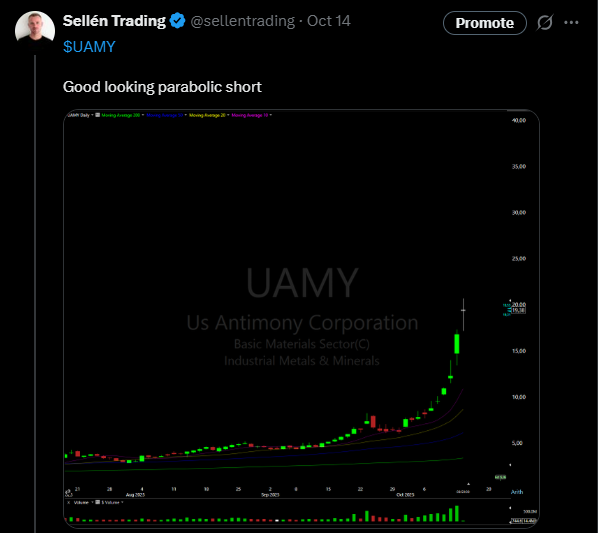
The $UAMY chart is one of the best parabolic shorts I’ve done in my career (Even if I sold too much, too soon, haha). The stock dropped around 20% on the first day, and I had a large position, so I took most of the profits after that.
That said, the parabolic short is also the riskiest setup of these, and I would recommend trading for 2-3 years before trying this. If you try to short these without stops, you can easily blow your account.
I would not recommend shorting anything at all if you don’t know what you are doing. But, I still think the parabolic short is the easiest short, since they move so quickly. Here’s what to look for:
- Stock up 100%-300%+ within a month
- The stock has been gapping up 2-3 days in a row
- The curve looks parabolic
- The stock is trading a massive number of shares
- People are euphoric about the stock
The best way to enter this is to wait for the first 1-minute candle to form, then enter if it breaks below the candle’s low, and place your stop at the day’s high.
How you take profits depends a lot on the stock. Many stocks will make most of their move on the first day, but in the examples above, they will go down for several weeks. I would still recommend taking the majority of the profit within 1-5 days, since they can bounce back so hard.
5. Mean Reversion
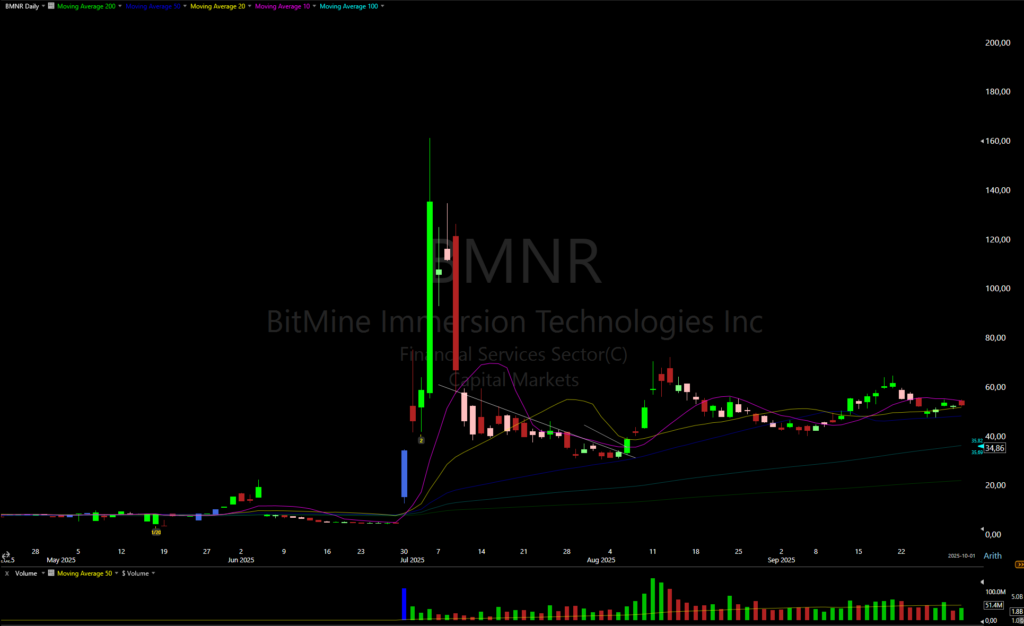
Another setup you will find after the parabolic short is the mean reversion long. This is exactly what I talked about, that they can bounce back so hard, and this bounce is the setup. After you’ve seen a parabolic short and the stock is down 50-80%, you will see a few tight days, and then you get a good long.
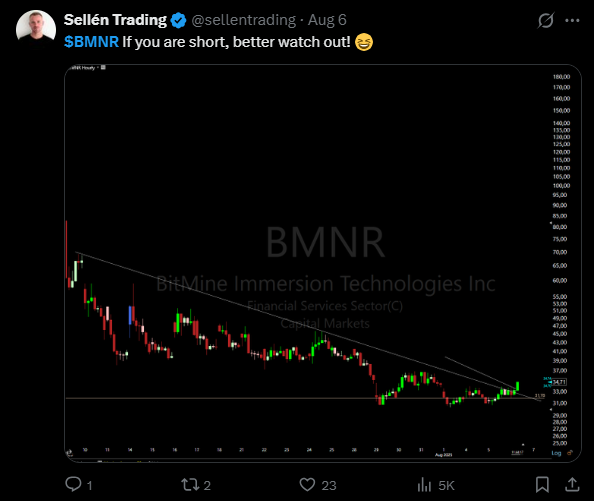
On the $BMNR chart above, I looked at the 1H chart to see the trend and went long when it broke that long trend. It did a 100% move within 5 days.
Think of these stocks as a rubber band: if they are stretched too far, they will bounce back hard. This is also a bit more advanced, and I would recommend learning breakouts, EPs, or base breakouts first.
With these setups, you often have to sell within 3-5 days, since that’s usually the end of the move, and after that, they will come back.
Entry is usually the same as in the other setups: you enter with a 1- or 5-minute opening-range high above the previous day’s high.
The critical things to trade successfully
While these setups are very high probability setups, if you trade them recklessly or trade them on the wrong type of stocks, it won’t work for you. Here are some tips to trade them successfully.
Focus on one setup
When you are starting, it’s easy to want to try out every setup. This is the wrong way to go about it. Become an expert in one setup first, and then move on to another. You need to have traded 100’s of examples and done a lot of homework to become an expert in a setup.
You need to do this to build your own conviction; you can’t get it from someone else. So make your own database with hundreds of examples of your setup, so you are confident next time you see it.
Momentum
Many people try to trade random choppy stocks that don’t go anywhere. Learning how to see momentum in a chart takes a lot of time, but trading stocks with high ADR and looking for the strongest stocks is a good way to filter them out.
Scanning for the right stocks is a big part of becoming profitable, and you can learn how I scan for momentum stocks in this post.
Liquidity
I only trade liquid stocks, usually those with daily dollar volume above $50M. They move more smoothly and often make bigger moves. They are not so prone to stop you with random wicks. You can easily enter with big size if you have a large account.
Follow your rules
It’s easy to learn setups and take trades; what’s more difficult is actually following your rules. If many stocks are down on the day, it’s easy to take profits in all of them to cut the pain, even if the stock didn’t close below the 10 or 20 moving average. Always follow your rules, even when things are rough.
If you want to learn the rules I use, you can check them out in my other article about my swing trading rules.
Patience
Patience is also a key to success. Just taking 1- or 3-star setups every day won’t make you profitable. You need to sit and wait for the outliers and trade them. You also need patience to wait for the move to develop fully.
Last Words
Trading may seem simple, but don’t get fooled. This is a challenging game, and you not only need the setups in order, but you also need to handle yourself, follow your rules, and not do stupid stuff.
You need to build your own conviction, and you do it by creating your own database with hundreds of setups, journaling all your trades every trading day. You need to take a look at your bad trades even when it hurts. Figure out what’s costing you money, and stop doing it. Look at your biggest winning trades, and do more of that.
I hope you liked this post. If you have any questions, leave a comment below. You can also follow me on X/Twitter to learn more about these setups.


