
When you start learning about swing trading, you will quickly realize that there is an ocean of different indicators and other technical measurements out there on the market.
There are even more opinions on whether indicators work. So what’s really the answer, and whom can you trust when it comes to this?
Today I’ll show you the best indicators I personally use for my own swing trading and talk a bit about whether it’s really necessary to use them at all. Let’s dive straight into it.
In This Article:
The Best Indicators For Swing Trading
While I’m not big into indicators when it comes to my own swing trading, there are still some of them that I find to be useful out there. Here are the indicators that I use:
1. Moving Averages
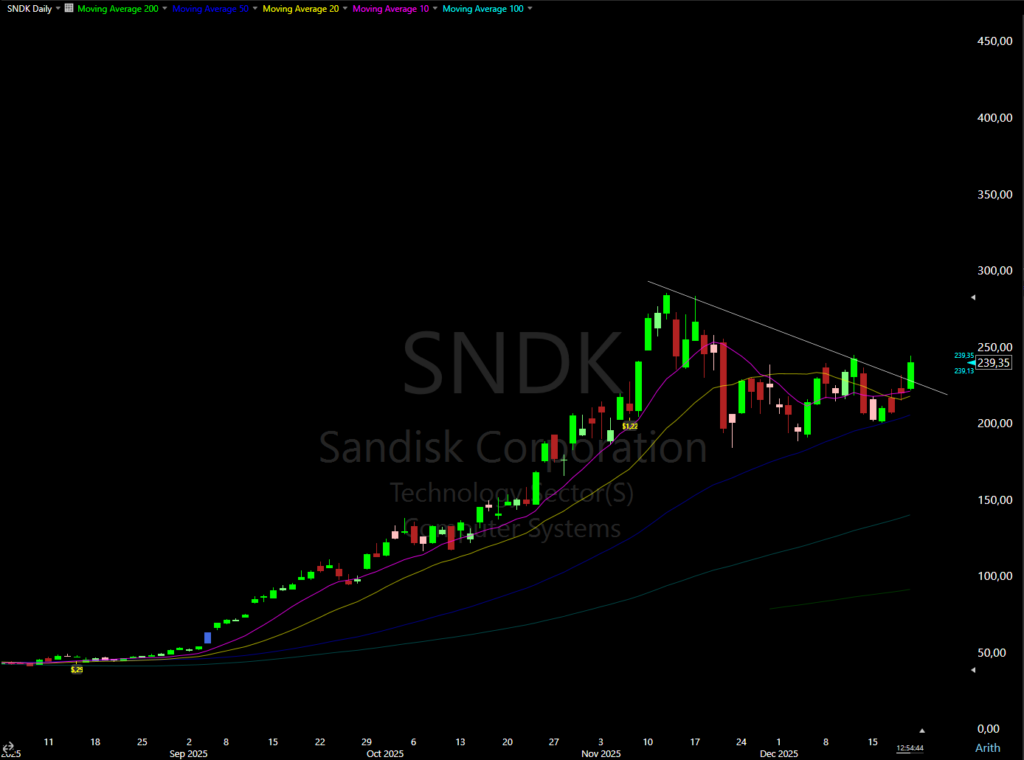
The first indicator is the simple moving averages. The moving averages measure the average price over a time period, for example, a 10 simple moving average measures the average price during the last 10 trading days.
I basically use the 10, 20, 50, 100, and 200- simple moving average. I chose simple moving averages over exponential because I did all my research with them and feel a bit more comfortable. Simple moving averages are slightly slower than exponential, and won’t react as quickly to quick price moves.
I usually use the 10 and 20 simple moving averages as stops for my positions. For example, if the price closes red below the 10- or 20-simple moving average, I might close my position or take a partial profit.
I use the 50, 100, and 200 moving averages more to better see trends, and I rarely trade stocks below their moving averages. This will ensure I only trade the strongest stocks. You can read more about the best moving averages in this article.
3. ADR / ATR
The next indicator I use is the ADR (Average Daily Range) or ATR (Average True Range). Whichever you use depends on which charting software you have, since many of them include ATR.
The main difference between ADR and ATR is that ADR doesn’t include gaps in its calculation, while ATR does. Both measure the daily range, essentially how much the stock moves each day.
Stocks with high ADR have high momentum and make larger price moves in a shorter amount of time, but they can also be more volatile. I usually never trade stocks below 5 ADR.
Here is a calculation for ADR % in TC2000 so you can see how this indicator looks:
100 * (AVG((H / L), 20) -1)Basically, it calculates the average percentage between the high and low for each day over the previous 20 days. You can set the number of days to whatever you like. You can learn more about the ADR and my scan criteria in my article on how I scan for stocks for my swing trading.
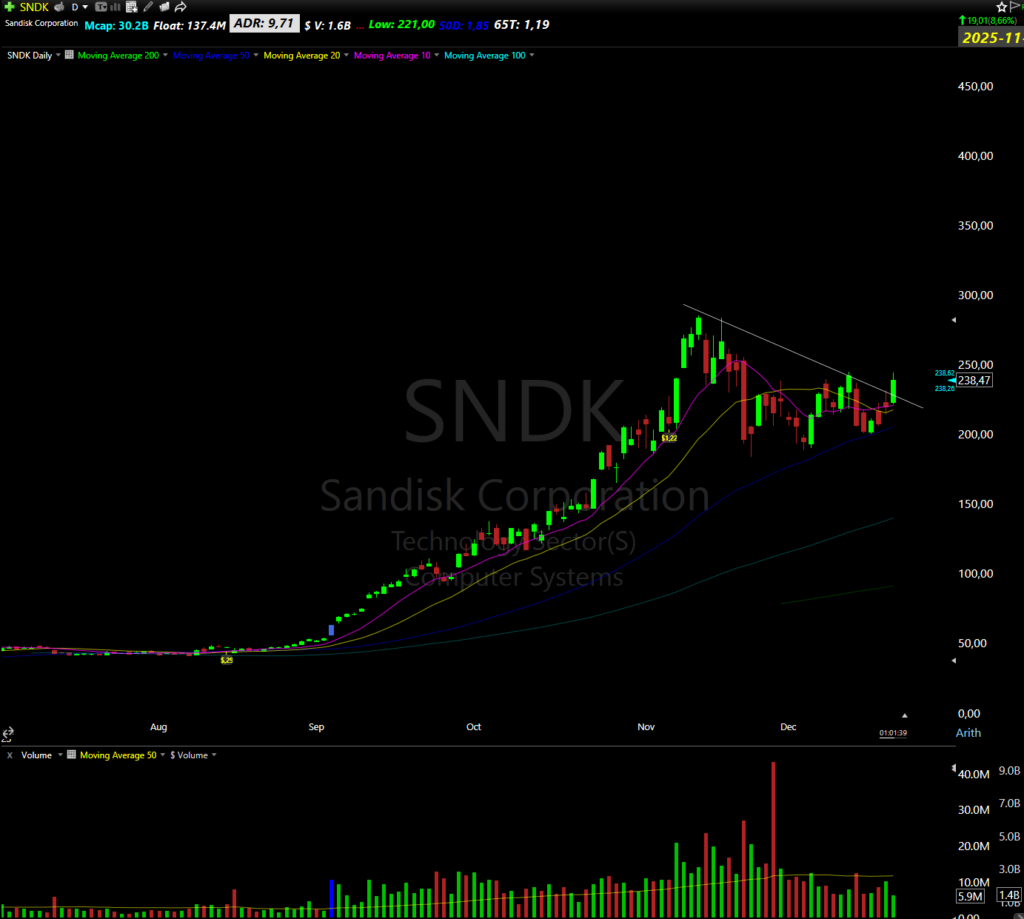
3. Volume
The next indicator is the very common and boring one, volume. While it seems like most people have volume on their charts, many do not realize how powerful it can be when read correctly.
I usually like to enter swing trading setups when volume is dropping and the current day has lower volume than the previous day. This will result in explosive moves.
You also don’t want to trade stocks that have had many distribution days recently. Distribution days are usually several down days on heavy volume; this means someone is selling it, and it’s less likely to continue rising in price.
4. Relative Strength
Another indicator that I use is the relative strength. How your software measures relative strength depends on your charting platform, but most compare price strength against $SPY or $QQQ over 1 year.
Stocks that have high relative strength and go sideways or up, while the indexes are pushing lower, are more likely to explode higher when the indexes turn up.
There are many use cases for relative strength, and it should really not be compared with RSI, which is a common indicator for swing trading. I don’t use RSI because I have found it quite useless for my own trading. Just because something is oversold or overbought doesn’t mean it can’t go much higher or lower.
5. 50 Simple Moving Average Extension
Another indicator I use sometimes, though not very often, measures the % of the stock compared to its ADR/ATR relative to the 50 moving average. It’s calculated like this in TC2000:
((C - AVGC50) / AVGC50 * 100) / (100 * (AVG(H / L, 20) - 1))It’s basically the distance from the price to the 50 simple moving average, then dividing it by the stock’s Average Daily Range. If you study history, you will see that many of the stocks rarely go higher than 10x ADR from the 50 simple moving average, and in these cases, this indicator might signal that it’s time to take some profit.
That said, as discussed before, just because a stock is extended doesn’t mean it can’t go higher. So follow your rules and don’t rely just on this indicator. It’s more of a sign that the stock might get a bit extended.
It can also be helpful to avoid taking new flag breakouts on stocks that are very far away from the 50 simple moving average, since these are very likely to fail sooner or later.
6. MACD
We also have the MACD (Moving Average Convergence Divergence) indicator. This is basically an indicator that makes it easier to see stock trends and when they’re likely to turn.
That said, I don’t use it daily, but there are definitely some use cases for it, and you can try it yourself to see if you like it. The main thing is to do enough research with an indicator to gain confidence in it, and then it can be beneficial.
7. TI65
At the bottom of this list is the TI65 indicator, created by the famous stock trader and teacher Stockbee. The TI65 stands for Trend Intensity 65, and it’s calculated like this:
avgc7/avgc65It calculates the % difference between the 7-day and 65-day simple moving averages. It’s a great indicator to measure how much the stock is trending up and how much momentum it has.
This is really not an indicator I use much nowadays, but earlier in my career, I used it to scan for stocks with high momentum. After a while, you will learn to see this more clearly just by looking at the chart, though.
Swing Trading With vs. Without Indicators
As you can see in this list, I don’t use many indicators and try to keep things as simple as possible. In my experience, the problem with many indicators is that they can provide conflicting information and freeze you.
What if you have four different indicators, and two of them say it’s good to buy a stock now, but the other two say it’s definitely not a good time to buy the stock? You might miss a good opportunity you would’ve taken if you’d had the information from the indicators.
After all, all indicators are calculated from price and volume across different timeframes. You can definitely become an excellent trader without using any indicators. I actually think it’s better, many times, not to use many of them.
Last Thoughts
So there it is: all the indicators I use for my own swing trading. Now it’s up to you to choose which you find helpful. At the very least, you could use price, volume, and moving averages in the beginning to keep things simple.
Journal all your trades, track all big movers, and save them in a database to gain conviction on how it usually looks before they make a big move. This is better than any indicator out there.
If you have any further questions about the best indicators for swing trading, leave a comment down below, and I will try to answer as soon as possible. You can also find me on X/twitter where I post daily stock setups and other valuable trading knowledge.


