
In This Article:
People often ask which indicators work best for swing trading. I choose them based on what I need to understand about a stock and whether that information helps me evaluate a trade setup. In this guide, I explain the best swing trading indicators I use, what I look for with each one, and how they fit into my process.
How I choose swing trading indicators
I don’t believe there is one best trading indicator for every person, stock, or market. Most indicators are calculated from price, volume, or both, so adding several that show similar information can make a chart harder to read.
I use a small group of tools for different jobs: trend, volatility, trading activity, and relative performance. Price action and my own trading rules still matter more than any single line or reading.
7 best swing trading indicators I use
This is a list of the tools I use or have used in my own stock trading. It isn’t a universal ranking, and I don’t use every indicator every day.
| Indicator or measure | What I use it for | What it can’t tell me |
|---|---|---|
| Moving averages | Trend context and close-based position management | Whether a price level will hold or a trade will work |
| ADR/ATR | Recent price range and volatility | How volatile the stock is |
| Volume | Trading activity around price moves and consolidations | Who is trading or what they will do next |
| Relative strength | How a stock has performed compared with a market index | Whether it will continue to outperform |
| 50-SMA extension | How far price has moved from its 50-day SMA relative to ADR | A fixed sell signal or reliable reversal point |
| MACD | An occasional view of trend and momentum | A precise prediction of a turn |
| TI65 | A scan measure comparing shorter- and longer-term averages | A standalone entry signal |
1. Moving averages
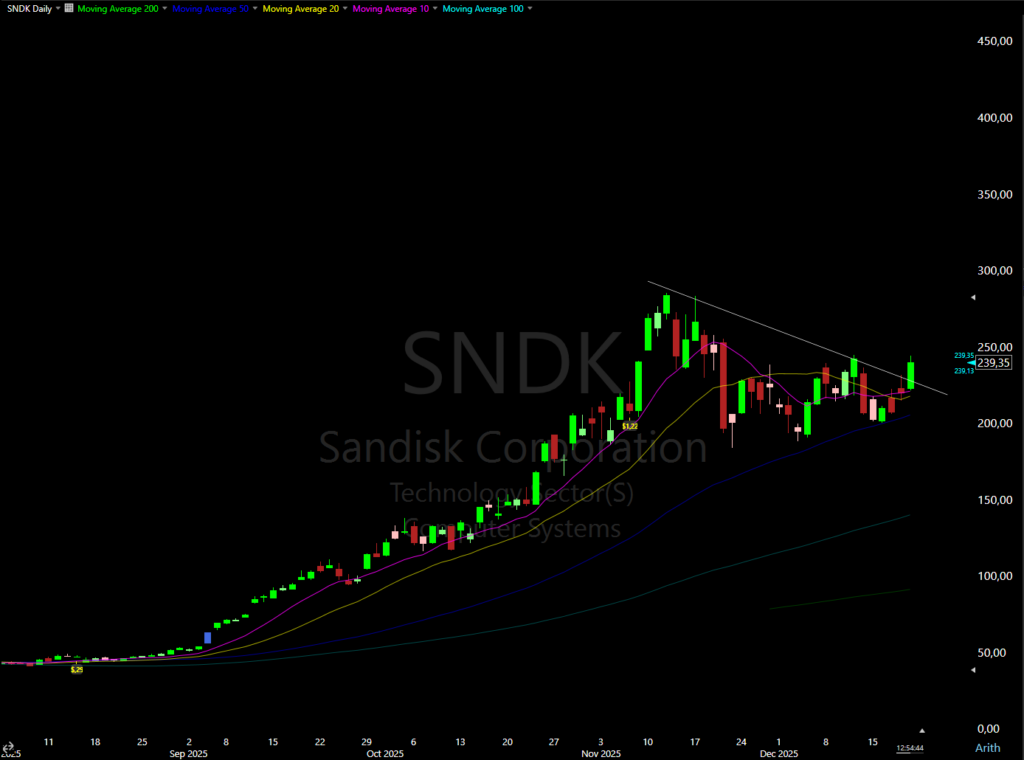
A moving average smooths past prices over a selected period. For example, a 10-day simple moving average (SMA) averages the closing prices from the last 10 daily bars. It can help me see the trend more clearly, but it is based on past prices and will lag behind a fast move.
I use the 10-, 20-, 50-, 100-, and 200-day SMAs. I prefer simple moving averages because that is what I studied and became comfortable with. An exponential moving average gives more weight to recent prices, so it generally reacts faster. I don’t consider one type automatically better for every trader.
The 10- and 20-day averages are the ones I use most when managing a position. In my current process, a daily close below an average can trigger an exit or partial-profit rule, depending on the position and my plan. The 50-, 100-, and 200-day averages give me broader trend context and help with screening.
A moving average is a reference, not guaranteed support or resistance. Price can move through it and continue in either direction. You can read more about how I use them in my article about moving averages for swing trading.
2. ADR and ATR
Average Daily Range (ADR) and Average True Range (ATR) help me gauge how much a stock has been moving. ADR is based on the daily high-to-low ranges. ATR also includes gaps from the previous close, so the two measures can differ, especially in stocks that gap often.
I use ADR% as a way to compare a stock’s recent average range with its price. A high ADR% tells me the stock has been volatile; it does not tell me that the stock has upward momentum. Volatility can create room for a larger move, but it also means price can move sharply against a position.
Here is the ADR% formula I use in TC2000:
100 * (AVG((H / L), 20) - 1)This averages the high-to-low ratio over 20 bars and expresses the result as a percentage. You can change the lookback period, but keep it consistent when comparing results. I use my scan criteria as a starting point, not as a rule that every stock must meet. I explain the rest of my process in my guide to swing trading stock scans.
3. Volume
Volume is a basic part of my chart reading. It shows how many shares traded during a bar, which gives me context for a breakout, pullback, or consolidation. It doesn’t identify who bought or sold, and it can’t confirm by itself what price will do next.
I often prefer to see volume contract as a stock consolidates after a strong move. That can show less trading activity during the pause, but it does not guarantee a breakout. I want to see how price behaves at the level I’m watching and whether my setup and risk rules are still valid.
I also pay attention to repeated high-volume declines. They can be a sign of increased selling activity, but they don’t prove that a particular group of traders is selling or predict that the decline will continue. I consider them alongside the price trend and broader market.
4. Relative strength
I use relative strength to compare a stock’s performance with an index such as the S&P 500 or Nasdaq 100. The exact calculation depends on the platform and the period selected, so I check what my software is comparing before interpreting the reading.
A stock holding up while an index is falling may be showing relative strength over that period. I find that useful when building a watchlist, but it doesn’t guarantee the stock will outperform later or rise when the market turns.
Relative strength is not the same as the Relative Strength Index (RSI). RSI is an oscillator that uses a 0-to-100 scale. I don’t use RSI in my current process because overbought or oversold readings don’t give me the kind of information I want. A stock can stay overbought in a strong trend or oversold during a continued decline.
5. Extension from the 50-day SMA
I sometimes use this calculation to see how far a stock has moved from its 50-day SMA relative to its ADR. It gives me a way to compare extension across stocks with different prices and daily ranges.
Here is the TC2000 formula:
((C - AVGC50) / AVGC50 * 100) / (100 * (AVG(H / L, 20) - 1))The first part measures the percentage distance between the close and the 50-day SMA. The second part estimates ADR% over 20 bars. The result expresses that distance in approximate ADR units.
I use a high reading as a reason to look more closely at how extended the stock is, not as an automatic sell or short signal. A stock can remain extended and keep rising. I haven’t established a universal threshold that should be applied to every stock or market.
6. MACD
MACD, or Moving Average Convergence Divergence, is calculated from moving averages and is commonly used to view trend and momentum. Traders often watch the MACD line, signal line, and histogram for changes in their relationship.
I don’t use MACD every day. It can be useful to study, but a crossover is not a guarantee that price is about to turn. In a choppy market, the lines can cross repeatedly. If you want to use it, test the settings and rules on the kinds of stocks and setups you actually trade.
7. TI65
TI65, or Trend Intensity 65, is a measure associated with the trader and teacher Stockbee. The version I used compares the 7-day and 65-day average closing prices:
AVGC7 / AVGC65This formula returns a ratio. For example, a reading of 1.10 means the 7-day average is about 10% above the 65-day average. A higher ratio means the shorter average is further above the longer one; it does not guarantee that the trend will continue.
I used TI65 more when scanning for momentum stocks earlier in my trading. I don’t rely on it much now, but I’m keeping it in the article because it was part of my process and may be useful to readers who want to explore it.
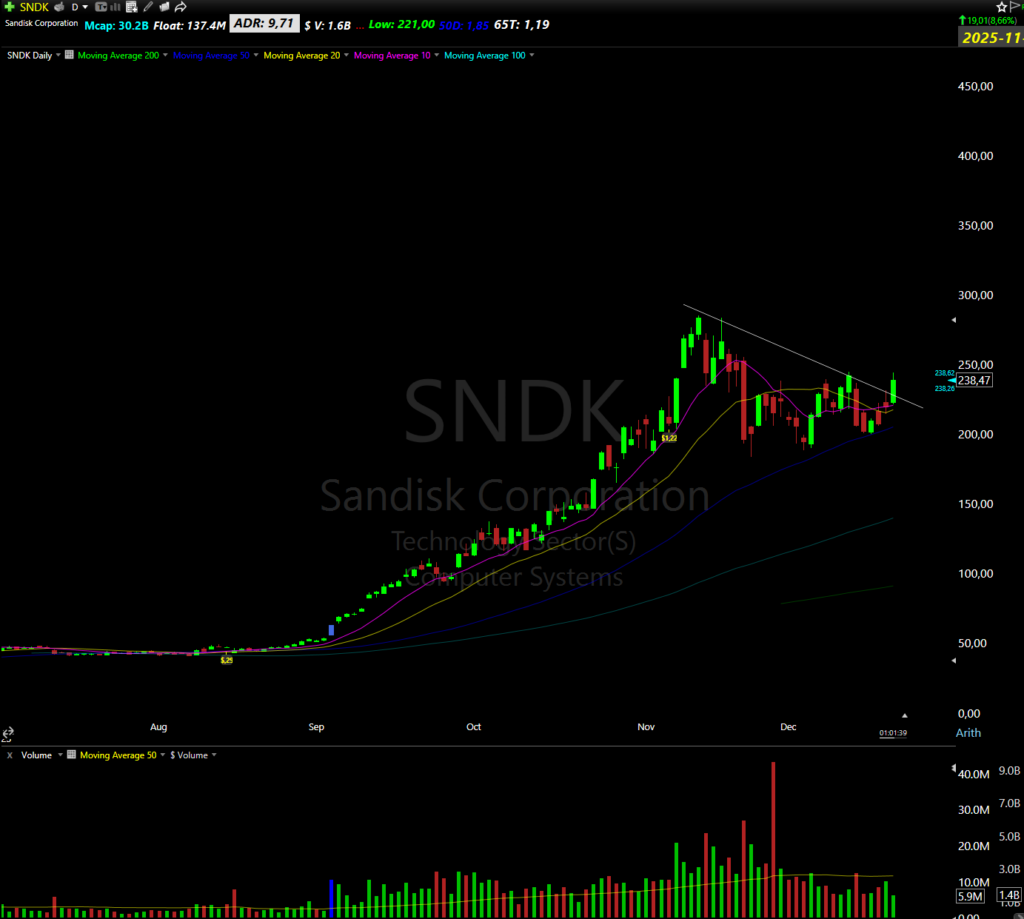
How I use these indicators together
I try to make each tool answer a different question. Moving averages give me trend context. ADR or ATR gives me a sense of recent range. Volume shows trading activity, and relative strength helps me compare a stock with an index.
I don’t need all seven on my chart at once. If two tools are giving me nearly the same information, I may remove one. I also check the actual price pattern and whether the trade fits my written entry, position-sizing, and exit rules.
Can you swing trade without indicators?
Yes. Indicators are optional tools for interpreting price and volume. A trader can study price action, chart levels, and volume without adding several formulas to the chart. I prefer a small number because too many tools can give conflicting readings and make it harder to follow a plan.
Final thoughts
These are the indicators and measures I use or have used in my own swing trading. Moving averages, volume, ADR/ATR, and relative strength are the ones I refer to most. MACD and TI65 are less central to my current process.
The best indicators for swing trading are the ones you understand, can test consistently, and can use without replacing your risk rules. I journal my trades and review the charts so I can see what helps my process and what adds noise.
If you want to see how these tools fit into stock selection, read my guide to scanning for swing trading stocks. You can also follow me on X, where I share charts and trading thoughts.