

In This Article:
There’s a lot of advice online about swing trading strategies, and it can be hard to know what to focus on. These are five setups I’ve traded and studied. I’ll show you what I look for in each one, how I approach entries and exits, and where I think the risks are.
The examples are from my own trading and chart study. A setup that worked on one stock is not proof that it will work on the next one. I use these patterns as part of a plan that includes market context, liquidity, an entry trigger, and a point where the trade idea is no longer valid.
The Swing Trading Setups I Trade
| Setup | What I look for | Main risk |
|---|---|---|
| Flag breakout | A strong move followed by a tight pause or consolidation | A breakout can fail and fall back into the range |
| Base breakout | A longer consolidation in a stock showing strength | Repeated false breakouts can lead to losses |
| Episodic pivot or earnings play | A major catalyst or earnings report followed by strong price action | Gaps and fast moves can make the risk difficult to control |
| Parabolic short | A sharp, accelerating rise followed by signs of a reversal | A stock can keep rising, creating large losses for a short position |
| Mean-reversion bounce | A sharp decline followed by stabilization and a possible change in short-term trend | A falling stock can continue falling instead of bouncing |
1. Flag Breakout
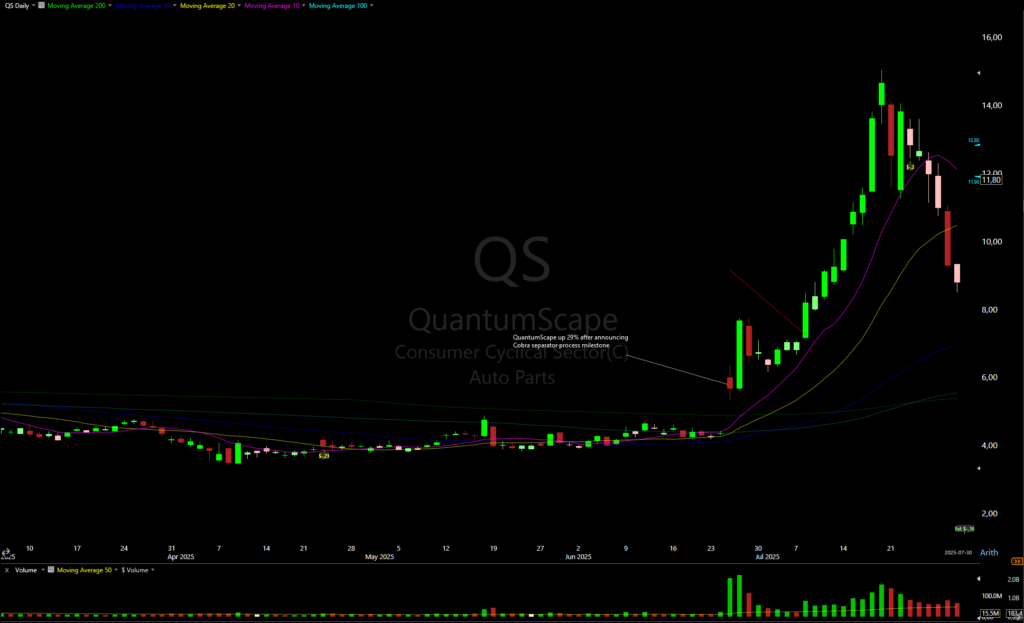
A flag breakout is a continuation setup I look for after a stock has made a strong move and then pauses. On the chart, the pause may form a short, relatively tight consolidation. I prefer to see the price range tighten and volume ease during the pause, though neither condition guarantees a breakout.
The QS chart above is a flag setup I traded. I also posted the setup on X before the move:
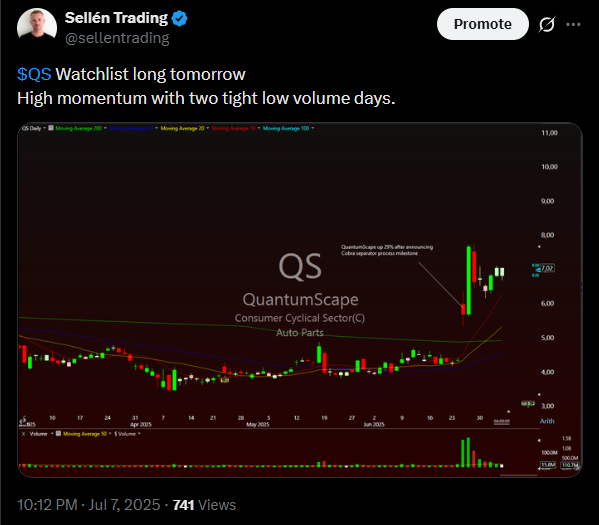
There are different ways to define a flag. In my process, I’m looking for a strong prior move, a pause that becomes tighter, and a price level I can use as a clear trigger. I prefer liquid stocks with enough trading activity to enter and exit without an unusually wide spread.
For some flag breakouts, I use a 1- or 5-minute opening-range high as an entry trigger, and I want the stock above the previous day’s high. I also like to see the 10- or 20-day SMA catch up to price when the stock is consolidating. These are parts of my process, not rules that make a breakout safe. If the distance to a sensible exit point makes the potential loss too large for my plan, I pass.
When I study a possible flag, I look for:
- A strong move before the consolidation. Some of the high-momentum stocks I study have gained 30% or more in a month, but that is an example from my own scans, not a requirement for every trader.
- A few days of sideways or relatively tight price action.
- Volume that is lower during the pause than during the prior advance.
- The 10- and 20-day moving averages moving closer to price, if the stock is consolidating long enough for that to happen.
- A clear price level that would trigger the trade and a separate level that would invalidate the idea.
- Enough liquidity for the position size I’m considering, with a spread I’m comfortable trading.
A longer flag or pullback to the 20-day SMA
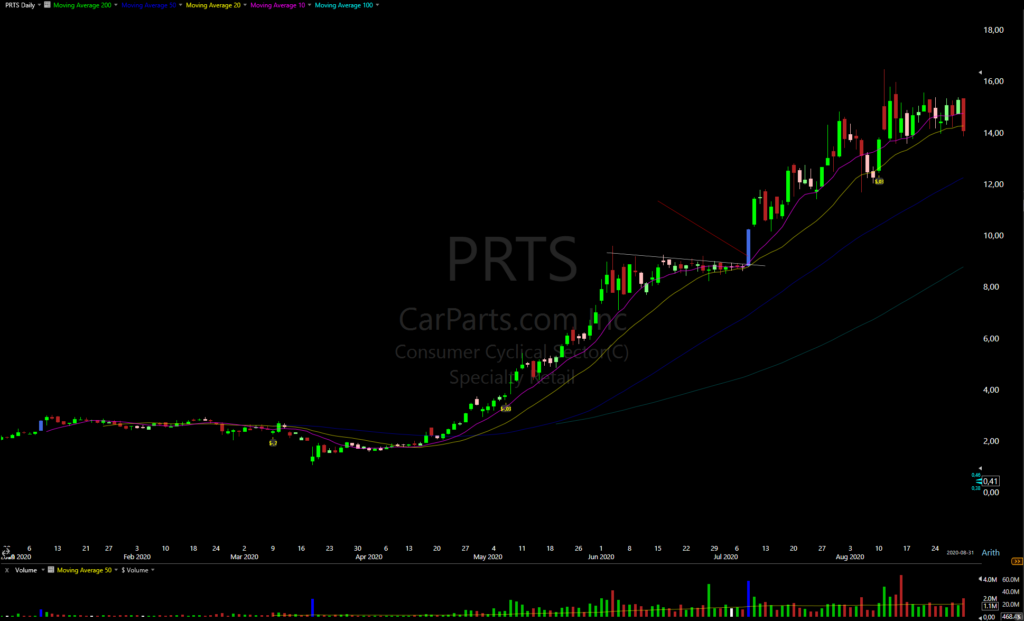
The QS example was a fast, high-momentum move. Other stocks pause longer and may pull back toward a rising 20-day SMA before tightening up again. The PRTS chart above is one historical example I like. I look at the moving average as context; I still want to see price stabilize and form a setup before considering an entry.
I prefer to study the first or second flag after a base breakout. Later flags can still work, but the stock may be more extended and the next breakout may have less room. That is something I check on the chart rather than assuming every flag is the same.
How I manage flag breakouts
In my own trading, a strong flag breakout may make much of its move within a few days. If it has made a sharp move after three to five days, I may take partial profits and manage the rest using my planned exit rule, such as a red daily close below the 10-day SMA. The exact decision depends on the stock and the trade plan I set before entering.
A moving-average close is one way I manage some positions, not a guarantee that I’ll exit at a particular price. Stocks can move quickly, and a stop or exit order may fill at a different price during a gap or fast market.
2. Base Breakout
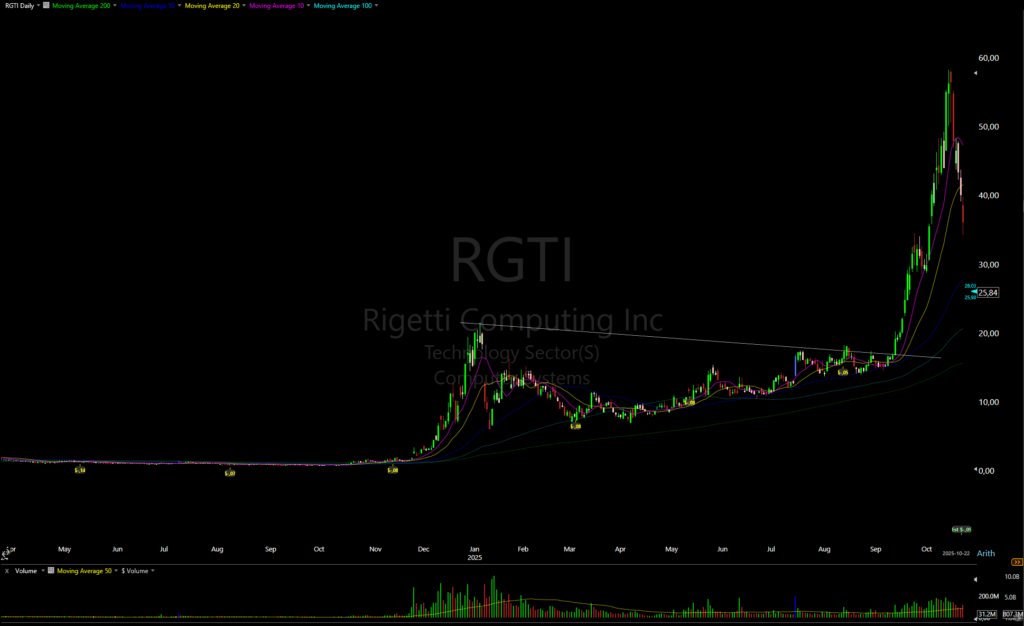
A base breakout develops after a stock has traded sideways for a longer period. I look for a stock that has shown strength over the prior 12 to 24 months, then formed a relatively tight area of consolidation. The RGTI chart above is one example I studied after noticing a tight, lower-volume week on the weekly chart.
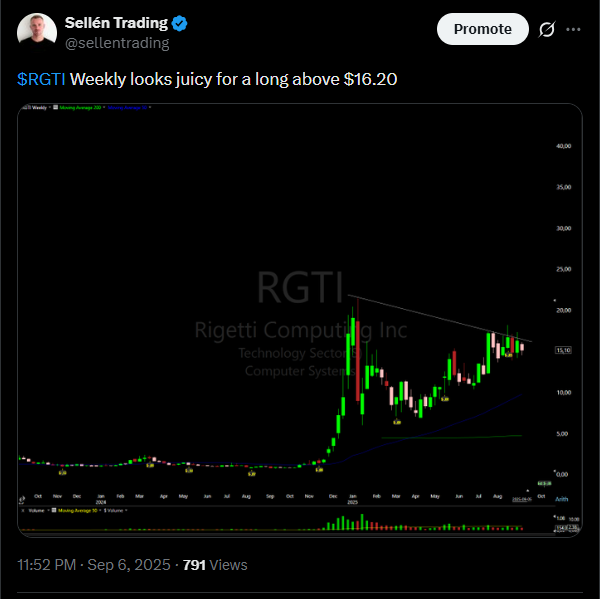
The appeal of a base breakout is that a stock may be starting a new move before it forms its first flag. The risk is that price can break above the range and then fall back into it. I’ve seen stocks make several failed attempts before a lasting move develops, so I don’t assume a breakout will hold just because it clears a prior high.
When I study a base, I draw the important prior highs and look for higher lows and tighter price action. I also pay attention to the moving averages. In a strong setup, the shorter averages may be above the longer ones, such as the 10-day SMA above the 20-day, and the 20-day above the 50-day. I use that alignment as a trend reference, not as a requirement or a buy signal on its own.
For historical examples of strong base breakouts, I’ve studied stocks such as NVDA and SMCI in 2024. Those examples show what I look for, but they don’t show how often similar-looking setups fail.
Because a successful base breakout can develop into a larger move, I may avoid taking profits too quickly. I may take a partial after a strong move and use a planned price or moving-average exit for the rest. If you’re testing this setup, write down your entry, invalidation point, and exit rules before the trade so you can review the result consistently.
3. Episodic Pivots and Earnings Plays
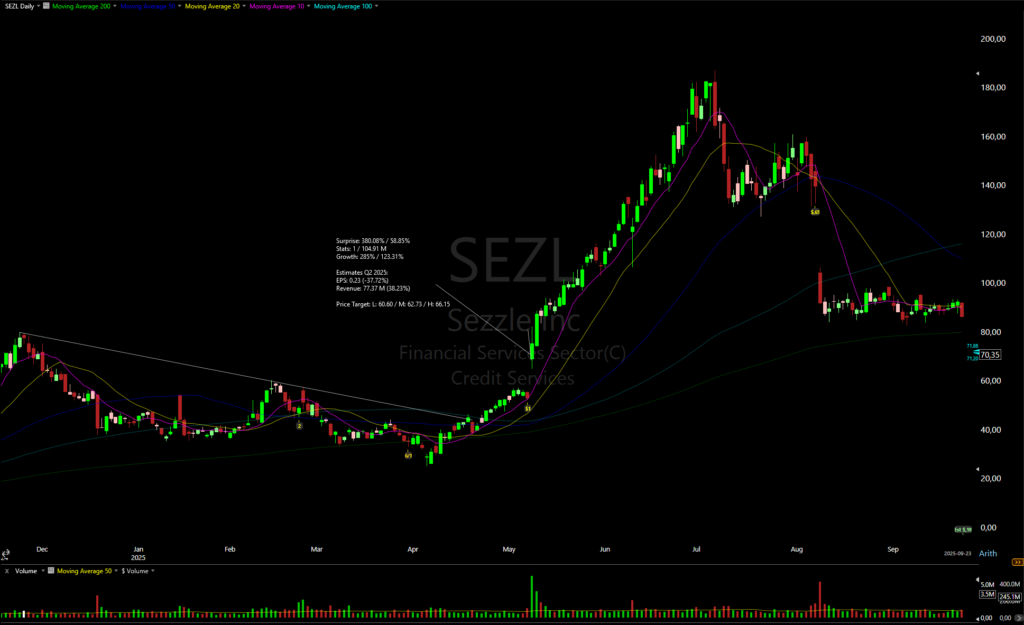
EP can mean “episodic pivot” or “earnings play,” depending on the trader. I think of them as related but different setups. An episodic pivot usually follows a significant, unexpected company development that may change how the market views the business. An earnings play is based on the company’s quarterly results and the market’s reaction to them.
Earnings plays are more common in my trading because public companies report results regularly. I look at the price action after the report, the size and direction of the gap, the chart structure, and the company’s growth. I’ve found revenue growth and the chart pattern more useful in my process than focusing on an earnings surprise number alone.
Some things I may look for include:
- Strong annual revenue growth. I often look more closely at companies with growth above 30%, but that is my preference, not a universal cutoff.
- A chart that is coming out of a base or forming a clear post-earnings setup.
- A gap that holds above important moving averages, especially if those averages were declining before the report.
- A meaningful earnings or revenue surprise, which can add context but doesn’t guarantee the stock will continue higher.
- Price and volume action that supports the trade idea after the initial news reaction.
I often use a 1- or 5-minute opening-range high as an entry trigger and may use the day’s low as a reference for where the setup would be invalidated. Earnings stocks can move quickly, though, and the distance to that low can be too large for my planned risk. I skip the trade or reduce the position size when the risk doesn’t make sense for me.
If I’m stopped out, I may watch to see whether the stock reclaims the high or builds a new setup above VWAP on a smaller timeframe. I don’t re-enter automatically; I want a new trigger and a risk level I can define.
For an earnings play that moves strongly, I may take partial profits after a few days and trail the rest using a rule I chose in advance, such as a red daily close below the 10- or 20-day SMA. The decision depends on the stock’s movement and my plan. Earnings gaps can reverse sharply, and a stop may not fill at the exact price you expect.
4. Parabolic Short
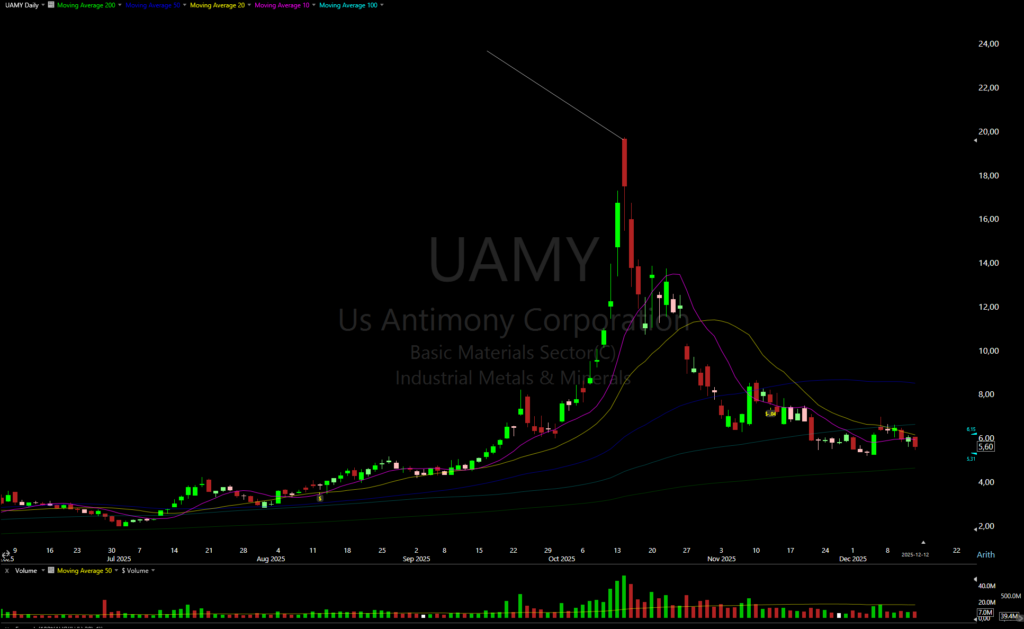
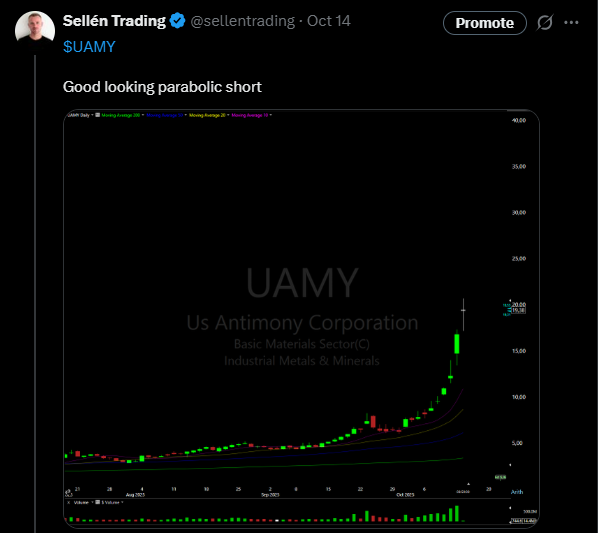
A parabolic short is a countertrend setup I consider when a stock has risen sharply over a short period and the move appears to be accelerating. I may look for several strong up days, consecutive gaps, and signs that the move is becoming climactic. A steep chart alone is not enough reason for me to short a stock.
The UAMY chart is one of the best parabolic shorts I’ve traded. I sold much of my position too early, but the stock dropped around 20% on the first day of the move down. That was my experience in this one trade, not a typical outcome or a result to expect from future shorts.
This is the riskiest setup in this article, in my opinion. A stock can keep rising much longer than expected, and short sellers can face very large losses. Gaps, trading halts, borrow costs, and hard-to-borrow shares can add risk. A stop order cannot guarantee a fill at the stop price during a fast move.
I would not suggest this as a beginner setup. If you’re new to trading, study historical charts or paper trade first. Time spent trading does not remove the risks of short selling, and I would not take a short without a defined risk plan.
When reviewing a possible parabolic move, I may look for:
- A very large rise over a short period. Some examples I study have gained 100% or more in a month, but that is a descriptive example, not a fixed trigger.
- Several consecutive gaps or unusually large daily moves.
- A price curve that is accelerating rather than moving in a steady trend.
- Heavy trading activity and signs of extreme attention or enthusiasm.
- A specific entry trigger and a clear point where the short idea is invalidated.
One entry method I have used is waiting for the first one-minute candle to form and considering a short if price breaks below its low, with the day’s high as a reference for invalidation. This can still be a very wide or unreliable risk point. If the stop distance is too large, the trade is not suitable for my plan.
Some parabolic stocks make much of their decline in one day, while others remain volatile for weeks and can rebound sharply. I may take profits quickly rather than expecting a smooth decline. This is a high-risk trade, and the example should not be treated as a short recommendation.
5. Mean-Reversion Bounce
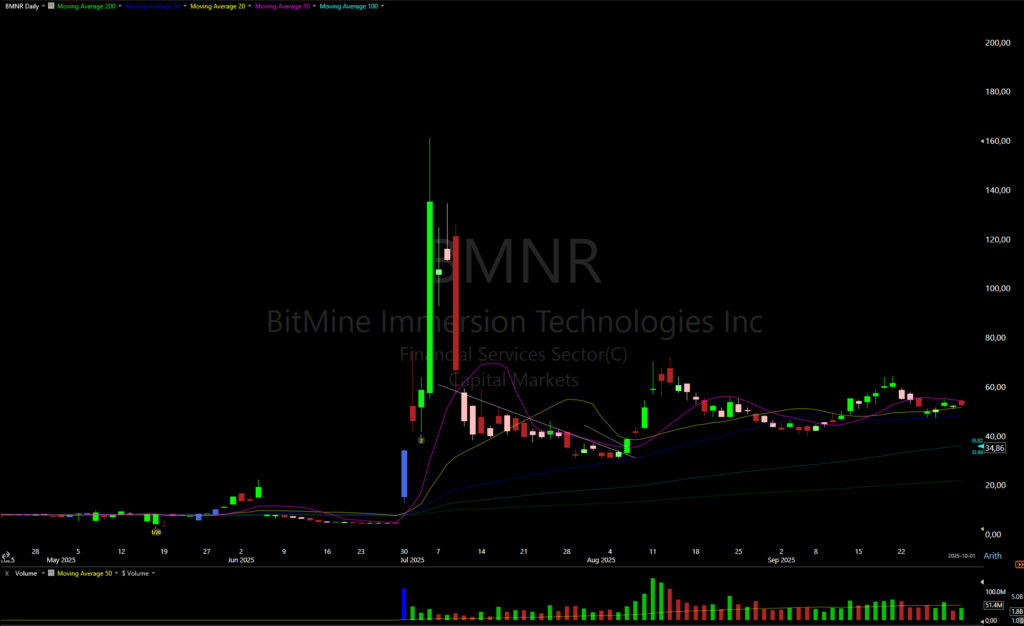
A mean-reversion bounce is a possible long setup after a stock has fallen sharply and then begins to stabilize. The idea is that a stock that has moved far and fast in one direction may bounce. It can also keep falling, so I wait for evidence that the short-term price action is changing before I consider an entry.
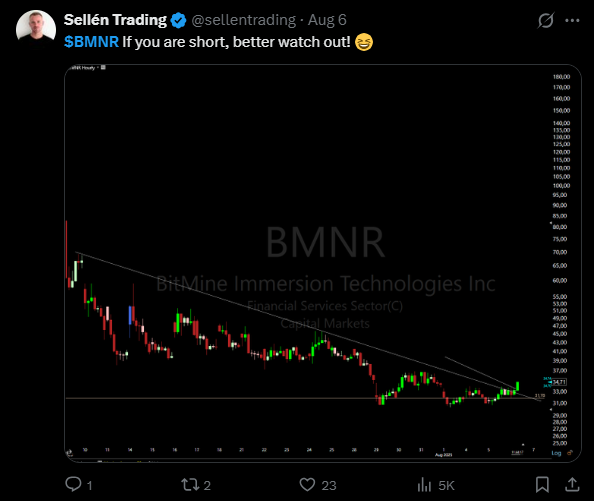
On the BMNR chart, I used the one-hour chart to study the short-term trend and entered when price broke above the trend I was watching. The stock later made a large move over five days. That is one historical example, not evidence that a similar bounce will happen in another stock.
I sometimes describe an extended move like a stretched rubber band, but that analogy can be misleading if taken too literally. A stock that is down 50% to 80% is not automatically due for a rebound. I want to see tighter price action, a clear change in the short-term trend, and a defined level that would invalidate the setup.
This is a more advanced setup in my view. I’d learn to identify continuation patterns and manage risk before trying to trade sharp countertrend bounces. When I do trade one, I often plan to manage it over a few days because the bounce can be brief and volatile.
Depending on the chart, I may use an opening-range high as a trigger, while checking that the stock is also above the previous day’s high. In the BMNR example, I focused on the one-hour trend break. The entry trigger has to fit the particular setup rather than being applied mechanically to every trade.
What I Focus on When Trading These Setups
Study one setup at a time
When you’re starting out, it’s tempting to try every pattern you see. I think it’s more useful to focus on one setup, collect examples, and review what happened before adding another. You can use historical chart study, replay, or paper trading to build that sample without risking money on every example.
I keep a database of setups and journal my trades so I can compare what I expected with what actually happened. Reviewing losing trades matters too. It can show whether I followed my plan, whether my definition of the setup was too loose, or whether the trade simply didn’t work.
Look for actual momentum, not just a high ADR
A high average daily range (ADR) means a stock has been moving through a wider daily range. It does not, by itself, show that the stock has upward momentum. I look at the direction of the move, the chart structure, and how the stock is performing relative to the broader market before calling it a momentum leader.
Scanning can help narrow down the list. See how I scan for swing trading stocks and the specific TradingView swing trading scan I use.
Check liquidity and the spread
I usually look for stocks with daily dollar volume above $50 million. That’s my preference, not a threshold that guarantees a smooth trade. Dollar volume can change from day to day, and even a stock with high volume can have a wide spread or become difficult to trade during volatile conditions. I check the spread and the amount I plan to trade before entering.
Define the risk before entering
Before I enter, I want to know what price action would show that my setup is failing and how much I could lose if that happens. A stop order may execute at a different price if a stock gaps or moves quickly. This matters especially for earnings plays, volatile low-priced stocks, and short positions.
These examples describe my process for studying trades. They aren’t a promise that a setup will be profitable or suitable for your account. You can read more about the rules I follow in my article on my swing trading rules.
Be selective and follow your plan
I don’t think you need to take a trade every day. I prefer to wait for a setup I recognize and can manage according to my plan. Once I’m in a position, I try to follow the rules I set in advance rather than changing them because the stock moves against me or because I’m worried about giving back a profit.
Frequently Asked Questions
What is the best swing trading setup?
There isn’t one best setup for every trader or market. I trade flag breakouts, base breakouts, earnings plays and episodic pivots, parabolic shorts, and mean-reversion bounces. The right setup for you depends on what you’ve studied, how you manage risk, and the market conditions.
Which swing trading setup is best for beginners?
I’d start by studying one setup on historical charts or in a simulator before risking money. I wouldn’t begin with parabolic shorts or fast earnings trades because they can move sharply and may be difficult to manage. Whichever setup you study, write down the entry trigger, invalidation point, and exit plan.
Are swing trading setups guaranteed to work?
No. A chart pattern can fail, and past examples don’t guarantee future results. I use setups to organize what I’m looking for, then manage each trade with a plan for the possibility that it doesn’t work.
Final Thoughts
Swing trading can look simple when you’re only looking at successful chart examples. In practice, it takes study, patience, and a willingness to review the trades that didn’t work. I’ve found it useful to build a collection of examples, journal my trades, and look honestly at both my mistakes and my best decisions.
If you have questions about these setups, you can find me on X, where I post charts and other trading thoughts.